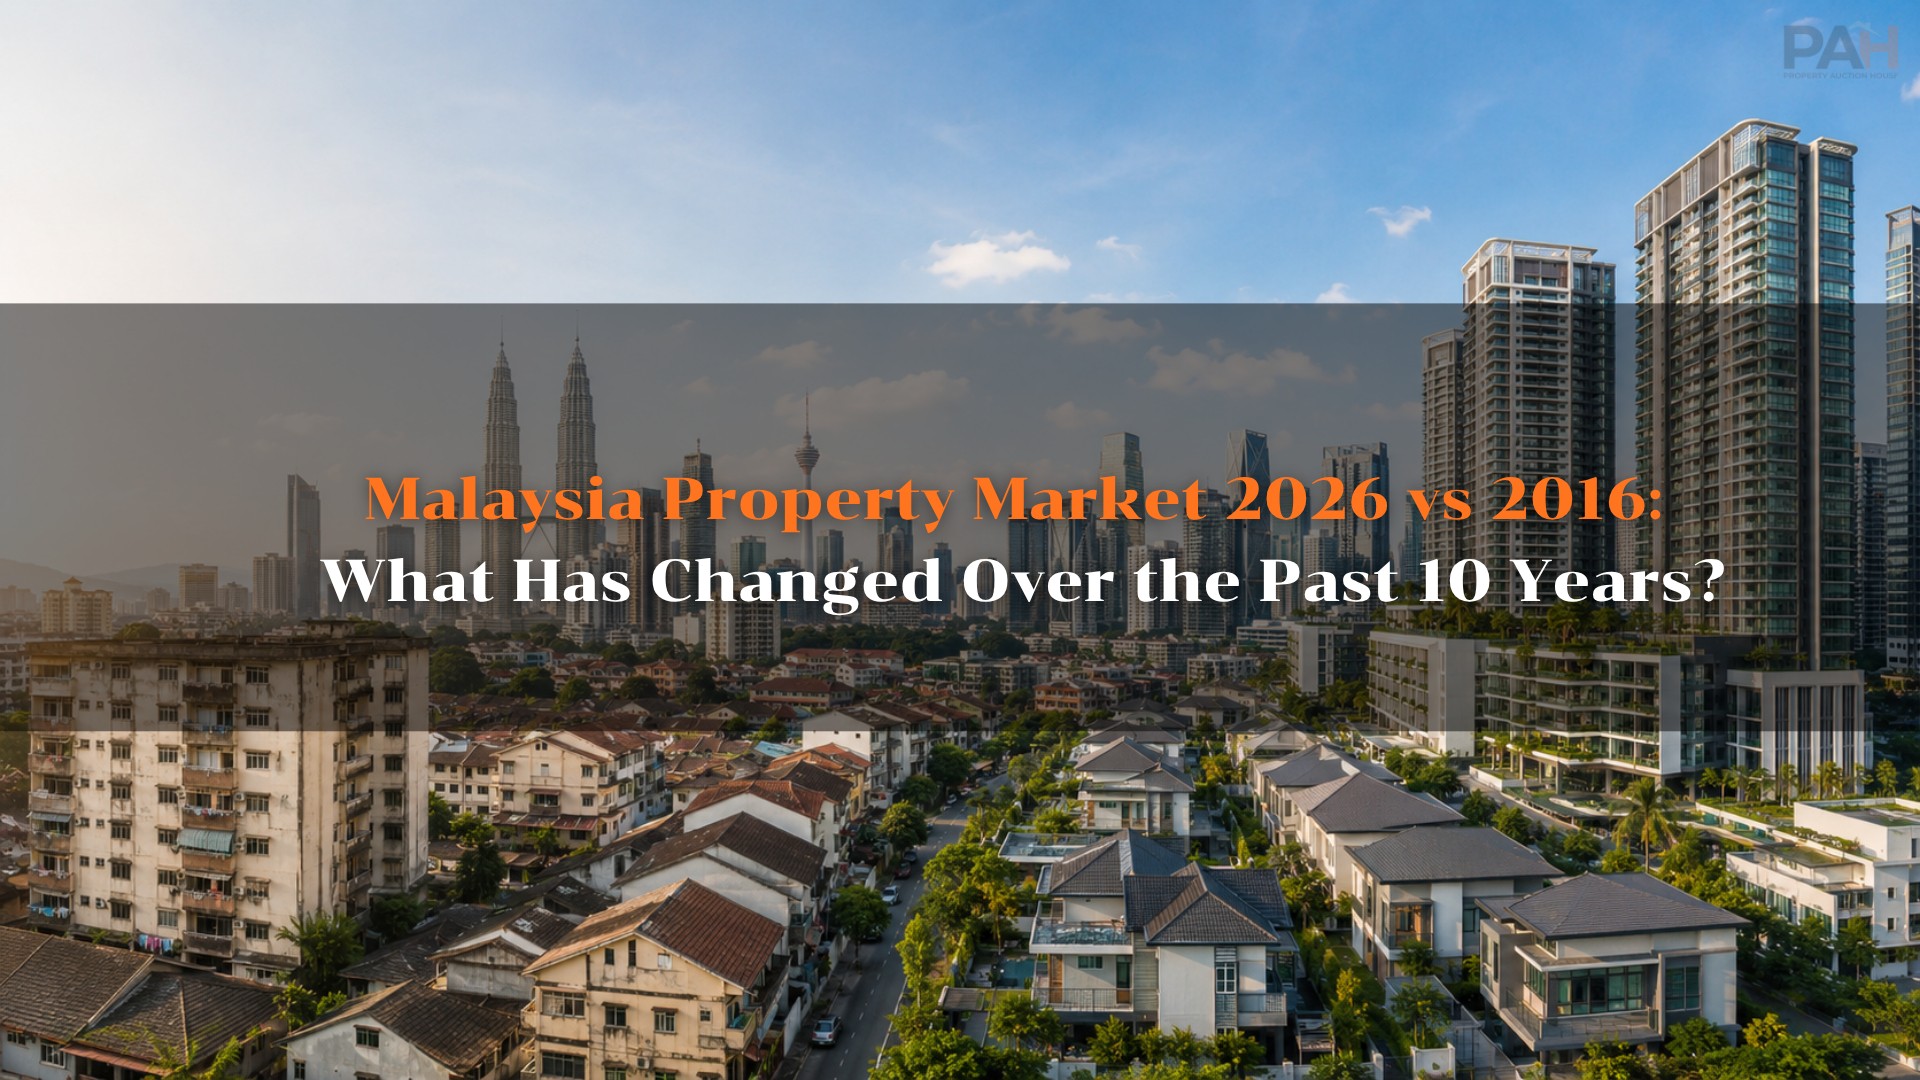
Malaysia Property Market 2026 vs 2016: What Has Changed Over the Past 10 Years?
From a market where house prices were rising relatively quickly despite slowing transactions in 2016, to a much larger property market in 2026 where competition and performance differences between segments have become increasingly important.
Malaysia Property Market: 10-Year Comparison
Ten years ago, Malaysia’s property market in 2016 was going through a period of moderation.
Transaction volumes were declining, but house prices were still rising relatively quickly. At the time, major market concerns included housing affordability, responsible lending and a shortage of homes within the price range that ordinary Malaysians could afford.
A decade later, the market looks very different.
The total value of property transactions is significantly higher, average house prices are at a higher level, buyers have more property types and supply to choose from, and new economic drivers have emerged — from Data Centres and the Digital Economy to Industrial Investment and the Johor-Singapore Special Economic Zone, or JS-SEZ.
At the same time, however, the number of completed but unsold residential properties is significantly higher than it was 10 years ago.
The key difference can therefore be summarised as follows:
Ten years ago, one of the main questions was: “How do we build homes that people can afford?”
Today, another important question has emerged:
“Are we building the right type of property, in the right location, for real market demand?”
Malaysia Property Market: 2016 vs Today
For a fair comparison, full-year market figures below compare 2016 with 2025, the latest year with complete annual data. Q1–Q2 2026 figures are used to provide additional context on current market conditions.
Indicator | 2016 | Current | Change |
|---|---|---|---|
Property Transactions | 320,425 | 416,413 (2025) | Approx. +30% |
Transaction Value | RM145.41B | RM241.87B (2025) | Approx. +66%* |
Residential New Launches | 52,713 | 64,487 (2025) | Approx. +22% |
New Launch Sales Performance | 31.4% | 35.5% (2025) | Slight increase |
Residential Overhang | 14,792 | 32,801 (Q1 2026) | More than doubled |
Overhang Value | RM8.56B | RM16.37B (Q1 2026) | Nearly doubled |
House Price Growth | Approx. 7.1% | 2.6% (2025) / 1.7% YoY Q1 2026 | Still rising, but more slowly |
OPR | 3.00% at end-2016 | 2.75% in Jul 2026 | Slightly lower |
GDP Growth | 4.2% | 5.2% (2025) | Stronger growth |
* Transaction value figures are nominal and have not been adjusted for inflation.
1. Today’s Market Is Larger Than It Was 10 Years Ago
In 2016, Malaysia recorded approximately:
320,425 property transactions worth RM145.41 billion
In 2025, the latest full year of available data, the market recorded approximately:
416,413 transactions worth RM241.87 billion
This represents an increase of around 30% in transaction volume.
Nominal transaction value increased by approximately 66%.
However, the 66% increase should not be interpreted as an equivalent increase in the market’s real value because the figures have not been adjusted for inflation, land prices, construction costs or changes in the types of property being transacted.
What is clear is that:
Malaysia’s property market today is significantly larger in transaction value and overall activity than it was 10 years ago.
2. House Prices Are Still Rising — but More Slowly
One of the biggest differences is the pace of house price growth.
In 2016, the Malaysian House Price Index recorded growth of approximately:
7.1%
In 2025, house price growth was approximately:
2.6%
And in Q1 2026:
1.7% YoY
The national average house price in Q1 2026 was approximately:
RM507,533 per unit
The current market can therefore be described as:
Higher Price Level + Slower Price Growth
House prices are at a higher base than they were 10 years ago, but they are no longer increasing at the same pace.
For investors, this changes the investment equation.
Rather than relying mainly on Capital Appreciation, greater attention should now be given to:
Rental Yield + Entry Price + Demand + Holding Cost + Exit Strategy
3. Supply and Residential Overhang Are Higher
In 2016, Malaysia recorded approximately:
14,792 residential overhang units worth RM8.56 billion
By Q1 2026, completed but unsold residential properties had increased to:
32,801 units worth RM16.37 billion
The number of units is therefore more than double the 2016 level.
There were also approximately:
19,263 completed but unsold serviced apartments worth RM16.52 billion
However, these figures do not mean that every part of Malaysia is oversupplied.
Instead, they highlight a more complex:
Supply-Demand Mismatch
Investors therefore need to look beyond national statistics and analyse individual locations, property types and price points.
4. From “Not Enough Affordable Homes” to “Are the Homes Being Built Where Demand Exists?”
In 2016, Bank Negara Malaysia highlighted housing affordability and the shortage of reasonably priced homes as major issues.
Put simply:
People needed homes, but there were not enough homes within the right price range.
By 2026, the situation had become more complex.
Of approximately 32,800 completed but unsold residential units in Q1 2026, around 46.9% were priced at RM300,000 or below.
This shows that:
A lower price alone does not guarantee that a property will sell.
Location, employment, transportation, property type and local demand all matter.
The meaning of affordable housing therefore cannot be assessed by price alone.
5. New Launches Have Increased — but New Supply Does Not Equal New Demand
Malaysia recorded approximately:
52,713 residential new launches in 2016
By 2025, this had increased to:
64,487 units
an increase of approximately 22%.
Sales performance increased from around:
31.4% to 35.5%
Although this represents some improvement, it does not mean all new supply will automatically be absorbed by the market.
Investors need to distinguish between:
New Supply
and
New Demand
More projects being launched does not necessarily mean the number of buyers or tenants will increase at the same rate.
6. Interest Rates Are Not Dramatically Different from 10 Years Ago
At the beginning of 2016, Malaysia’s OPR stood at 3.25% before being reduced to:
3.00% in July 2016
As of July 2026, the OPR stood at:
2.75%
This is only around 0.25 percentage points below the end-2016 level.
However, OPR is not the same as the mortgage rate offered to individual borrowers.
Actual mortgage rates also depend on credit profile, loan-to-value ratio, loan tenure and individual bank policies.
7. Today’s Economic Drivers Are More Diverse
Malaysia’s GDP grew by approximately:
4.2% in 2016
In 2025, GDP growth was:
5.2%
while Q2 2026 recorded approximately:
6.0% YoY growth
The more important change, however, is not simply the rate of GDP growth but the emergence of new sources of demand.
Today’s property market is increasingly influenced by sectors such as:
Data Centres
Cloud Computing
AI Infrastructure
Advanced Manufacturing
Logistics
Industrial Property
Cross-Border Economic Zones
For example, Malaysia recorded approximately:
RM92.8 billion in approved investments in Q1 2026
Of this, Data Centre and Cloud Computing projects accounted for:
RM34.6 billion across 33 projects
Approved investment does not mean all the capital has already been deployed or that every project has been completed.
However, it demonstrates the increasing importance of Digital Infrastructure in Malaysia’s economic landscape.
8. Johor Has a New Economic Story
Johor in 2026 has economic drivers that were not present in the same form 10 years ago.
One of the most important is the:
Johor-Singapore Special Economic Zone, or JS-SEZ
covering approximately 3,588 square kilometres, with 9 flagship areas and 11 economic sectors.
There is also the Johor Bahru–Singapore RTS Link, which is designed to improve cross-border connectivity between Johor and Singapore.
Together, these developments may support:
Employment + Infrastructure + Investment + Connectivity
However, this does not mean every property in Johor will automatically increase in value.
Investors still need to determine whether the demand created by these developments genuinely benefits the property’s specific location.
9. Investors Have Access to More Market Data
Another major difference between 2016 and 2026 is data transparency.
Today, NAPIC provides access to information such as:
Transaction Data
Residential Price Data
Property Status Data
MHPI
Open Sales Data
Data Visualisation
Property Affordability Calculator
Investors can therefore use actual transaction prices, supply statistics and price trends to make more informed decisions.
Simply saying:
“This property looks cheap”
is no longer enough when market evidence can be checked more easily.
Investors should increasingly rely on data rather than marketing stories.
10. What Has Changed Most for Property Investors?
In 2016
Major considerations included:
Affordability
Responsible Lending
Shortage of reasonably priced housing
Capital Appreciation
In 2026
Investors increasingly need to consider:
Demand
Location
Employment
Infrastructure
Rental Yield
Existing Supply
Total Acquisition Cost
Resale Liquidity
The investment question should therefore shift from:
“Will this property increase in value?”
to:
“Why will someone want to rent or buy this property from me in the future?”
What About Property Auctions?
For the auction market, these changes are particularly important.
As overall property price growth slows, investors should not rely on the assumption that:
“If I buy below market value at auction, the market will eventually lift the price.”
Instead, investors should calculate:
Winning Bid + Tax + Legal Cost + Financing + Renovation + Outstanding Cost + Holding Cost = Total Acquisition Cost
and compare this with:
Actual Transaction Value + Rental Potential + Resale Demand
A clear:
Maximum Bid Price
should be established before bidding begins.
It is also important to remember:
Residential Overhang is not the same as Auction Property or Foreclosure Property.
NAPIC does not currently provide a continuous national auction count that can be reliably compared between 2016 and 2026.
Completed unsold property figures should therefore not be used as a substitute for auction-property data.
Conclusion: The Market Is Bigger, but Investing Is Not Necessarily Easier
Malaysia’s property market in 2026 is clearly larger than it was in 2016.
Transaction values are higher, average house prices are at higher levels and economic drivers are more diverse.
At the same time:
Price Growth is slower
Supply is higher
Residential Overhang has increased
Demand differs significantly across segments
Today’s market is therefore not one where investors should buy a property simply because “the city is growing” or “the price is below market value”.
Investors need to determine:
Is there real demand?
How much competing supply exists?
Is the rental yield sustainable?
Does the purchase price still leave enough investment margin?
If the difference between Malaysia’s property market in 2016 and 2026 had to be summarised in one sentence:
Ten years ago, many opportunities came from overall market growth. In 2026, opportunities depend much more on selecting the right property.
For investors, the guiding principle should therefore not simply be:
Buy Below Market Value
but:
Buy the Right Property, in the Right Location, at the Right Price.
Frequently Asked Questions (FAQ)
1. Is Malaysia’s property market larger today than it was 10 years ago?
Yes. Malaysia recorded around 320,425 property transactions worth RM145.41 billion in 2016, compared with approximately 416,413 transactions worth RM241.87 billion in 2025.
The market is therefore larger in both transaction count and nominal transaction value.
2. Are Malaysian house prices still increasing?
Yes, but more slowly.
House price growth declined from approximately 7.1% in 2016 to around 2.6% in 2025 and 1.7% YoY in Q1 2026.
The current market therefore has higher prices but slower growth.
3. Does Malaysia have an oversupply problem?
Some segments have significant supply concerns, but it would be inaccurate to describe the entire country as oversupplied.
Residential overhang increased from around 14,792 units in 2016 to 32,801 units in Q1 2026, but demand differs substantially by location, property type and price point.
4. How should investors change their strategy compared with 10 years ago?
Investors should rely less on Capital Appreciation alone and pay more attention to:
Entry Price + Rental Yield + Actual Demand + Existing Supply + Total Acquisition Cost + Resale Liquidity
The key question is no longer simply “Will the price rise?” but “Who will rent or buy this property from me in the future?”
5. Are auction properties still attractive investments?
They can be, if purchased at the right price.
A low Reserve Price does not automatically make a property a good investment.
Investors should compare Auction Price with Actual Transaction Value, calculate the full Total Acquisition Cost and establish a Maximum Bid Price before bidding.
The objective is not simply to win the auction — it is to win at a price that still makes financial sense.